Local / Regional Impact
Sullivan County, PA, consists of approximately 452 square miles. As the future high-density industrial operation of gas drilling draws near, becoming as informed and educated as possible on the many aspects of drilling and its related impacts empowers us to be effective in getting the legislative protections and enforcement needed to ensure that our health, safety and environment so that both ourselves and future generations are not adversely affected.
The major waterways in Sullivan County are the Loyalsock Creek and the Muncy Creek—both flow into the West Branch of the Susquehanna River. Some streams along the eastern border of the county flow into the North Branch of the Susquehanna River. All of Sullivan county is thus within the Chesapeake Bay Watershed.
Impacts on Nearby Counties
Surrounding counties of Bradford, Clinton, Columbia, Lycoming and Tioga have far exposure to gas companies being a part of their everyday life. Fortunately for Sullivan County, one of the benefits of being a later county in the play is the opportunity to learn from others experiences. Watch an informative video on the impacts of the gas drilling industry on nearby counties.
Current projections provided by the Sullivan county commissioners include 1200 well pads and 6000 wells over the life of the Marcellus gas play in Pennsylvania. There are also projections for over 100 compressor stations, miles of gathering lines, and other industrial operations that come with the gas industry—which will most likely be in the area for the next 50+ years.
Updated 11/14/12 Sullivan County Click here to see the Sullivan County Planning Commissions slide show tracking actual gas drilling and pipeline development from 2009-2012.
Natural Gas Infrastructure in PA
This map shows natural gas infrastructure in Pennsylvania. Using this map, you can view natural gas facilities and pipelines, as well as report pollution directly to state and federal agencies. Click here to view map.
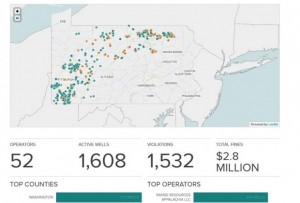
 Who’s drilling where? It’s the basic question everyone wants to know about Pennsylvania’s Marcellus Shale boom, and it’s something StateImpact’s interactive app will help answer.
More than 1,600 shale gas wells are plotted in the app, which reflects the state’s most-updated data for 2012. Click on a well, and you’ll learn who owns it, how much gas it’s producing, and whether Department of Environmental Protection inspectors have cited it for violations. Problem-free wells are green on the map. If inspectors have cited a site for violations, it’s plotted as a orange dot — and the citation details are listed on the page.
Click here to view StateImpact PAs Marcellus Shale app
Every single well has its own own page, so you can link to them or share them via Twitter and Facebook. If you think there’s more we need to know about the drilling site, there’s a space for you to share comments, stories or pictures.
The app helps answer broader questions, too. Trying to figure out who the biggest players are, or what areas are drilling hot spots? You can navigate to wells by county, municipality or operator to learn that information.
The app is based on data from DEP’s website. The department updates production information twice a year, and refreshes violation reports about once a month. The next production update is scheduled for early next month. The app will be refreshed soon as the new data is public.
Sullivan County Pipeline Maps
Learn more about the MARC 1 Pipeline and view the current Sullivan County Planning Commission gas drilling map (June 2017) showing the countys permitted well sites, as well as projected pipelines (MARC 1 in yellow) and gathering lines (green). Sullivan County Planning commission also has a map showing the pooling units in the county as of March 2017.
Eagles Mere Map
 On a more local level, the Eagles Mere Community will see changes because of Marcellus Shale Play. Public records show that much of the land surrounding the Eagles Mere Borough has been entered into lease agreements with the gas companies. Leasing records are updated over time, and it sometimes takes several weeks or months for leased lands to go on public record. To further complicate matters, researching mineral rights is a cumbersome process and even after lengthy work by professionals, it is not always clear who owns the mineral rights for a given property.
While this may seem complicated, at this point in time, records confirm that only about 10% of the Borough’s 1,521 acres have been leased. This puts community leaders in a good position to work collaboratively to assess how to protect the Eagles Mere community and its lake from any negative impacts of natural gas drilling.
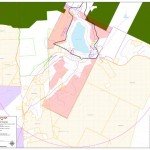
View the detailed map (6Mb file) showing parcels leased within and around the community. Besides showing leased properties (orange), the referenced map also details critical watershed areas (black line) and RA zoning (red) for the Borough. RA Zoning allows drilling if a conditional use permit has been submitted to and approved by the Borough.
Economic Impact Study in Local Counties
The Penn State Extension has conducted studies of how much of the economic benefits of gas drilling stay within Bradford, Sullivan, Susquehanna, Tioga and Wyoming counties. These studies mainly looked at the overall potential for the Commonwealth. How do the individual counties where major natural gas development is occurring fare?
It is important to know how much of the economic benefits stay local since that is where most of the direct costs of development are going to be found such as an influx of new workers, increases in traffic, increasing demands for services, greater demand for water and other natural resources, and more wear and tear on the infrastructure. Due to the high specialization of the business, it is clear that many of the economic benefits of gas development occur outside of the counties where drilling is occurring. However, from anecdotes, surveys and data reviewed, the money spent in these communities plays a significant role in the local economic impact. Much of this is seen in the secondary businesses such as local construction, trucking, hotels, food service and other non-specialized services not unique to the industry.
The studies done provide background on the drilling activity within each county, methodology used to estimate employment and income impacts, results, and a discussion on the findings. Click here to read the Sullivan county report, and click here to read reports on the other counties.

